U.S. Dairy Commercial Disappearance Update – Mar ’17
Executive Summary
U.S. dairy commercial disappearance figures provided by USDA were recently updated with values spanning through Jan ’17. Highlights from the updated report include:
 Butter – Disappearance Declines to a 21 Month Low on Weak Domestic Demand
Jan ’17 U.S. butter commercial disappearance declined 24.3% MOM on a daily average basis and 13.3% YOY, finishing at a five year seasonal low and a 21 month low overall. Jan ’17 domestic butter demand declined 14.7% YOY to a five year low for the month of January however international demand increased 126.6% from the nine year seasonal low experienced during the previous year. ’15-’16 annual U.S. butter disappearance increased 2.2% YOY as a 3.3% increase in domestic demand more than offset a 43.7% decline in export volumes. ’16-’17 YTD U.S. butter disappearance remains up an additional 4.0% throughout the first third of the production season, despite the recently experienced weakness.
Butter – Disappearance Declines to a 21 Month Low on Weak Domestic Demand
Jan ’17 U.S. butter commercial disappearance declined 24.3% MOM on a daily average basis and 13.3% YOY, finishing at a five year seasonal low and a 21 month low overall. Jan ’17 domestic butter demand declined 14.7% YOY to a five year low for the month of January however international demand increased 126.6% from the nine year seasonal low experienced during the previous year. ’15-’16 annual U.S. butter disappearance increased 2.2% YOY as a 3.3% increase in domestic demand more than offset a 43.7% decline in export volumes. ’16-’17 YTD U.S. butter disappearance remains up an additional 4.0% throughout the first third of the production season, despite the recently experienced weakness.
 Jan ’17 U.S. butter production and import volumes outpaced total disappearance figures, resulting in stocks increasing for the second consecutive month. Butter stocks typically increase seasonally from lows experienced throughout the month of November until seasonal highs are reached during the summer months.
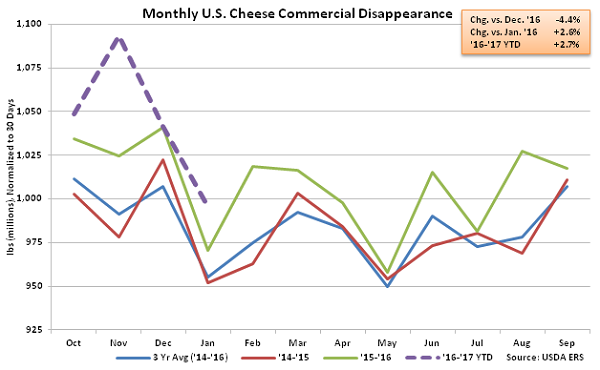
 Cheese – Disappearance Reaches a Record Seasonal High, Finishes up 2.6% YOY
Jan ’17 U.S. cheese commercial disappearance declined 4.4% MOM on a daily average basis but remained 2.6% higher on a YOY basis, finishing at a record seasonal high. Total cheese disappearance has finished higher on a YOY basis over 19 consecutive months through January. American cheese disappearance declined 1.8% YOY however the declines were more than offset by a 5.3% YOY increase in other-than-American cheese disappearance experienced throughout the month. Total domestic cheese demand increased 2.5% YOY throughout the month while export demand finished higher on a YOY basis for the fourth consecutive month, increasing by 3.3%. Domestic cheese disappearance increased 3.7% throughout the ’15-’16 production season, more than offsetting a 14.0% decline in export demand. ’16-’17 YTD cheese disappearance remains up an additional 2.7% throughout the first third of the production season as both domestic and export demand has strengthened.
Cheese – Disappearance Reaches a Record Seasonal High, Finishes up 2.6% YOY
Jan ’17 U.S. cheese commercial disappearance declined 4.4% MOM on a daily average basis but remained 2.6% higher on a YOY basis, finishing at a record seasonal high. Total cheese disappearance has finished higher on a YOY basis over 19 consecutive months through January. American cheese disappearance declined 1.8% YOY however the declines were more than offset by a 5.3% YOY increase in other-than-American cheese disappearance experienced throughout the month. Total domestic cheese demand increased 2.5% YOY throughout the month while export demand finished higher on a YOY basis for the fourth consecutive month, increasing by 3.3%. Domestic cheese disappearance increased 3.7% throughout the ’15-’16 production season, more than offsetting a 14.0% decline in export demand. ’16-’17 YTD cheese disappearance remains up an additional 2.7% throughout the first third of the production season as both domestic and export demand has strengthened.
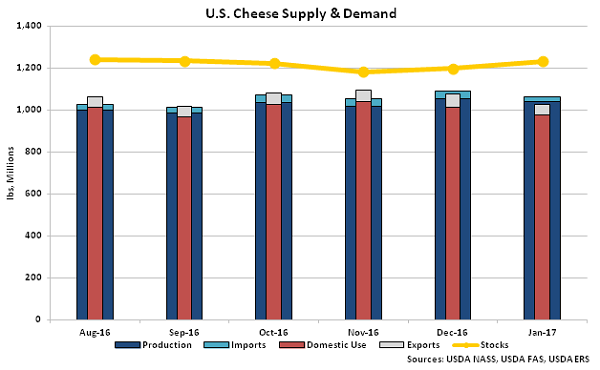
 Jan ’17 U.S. cheese production and import volumes outpaced total disappearance figures, resulting in stocks increasing for the second consecutive month. Cheese stocks typically reach seasonal lows during the month of November prior to building throughout subsequent months.
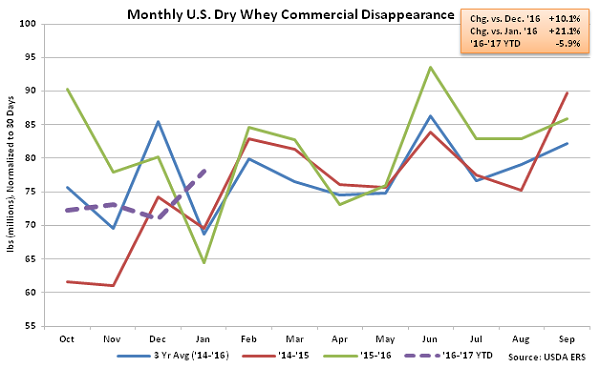
 Dry Whey – Disappearance Finishes Higher on a YOY Basis for the First Time in Five Months
Jan ’17 U.S. dry whey commercial disappearanceincreased 10.1% MOM on a daily average basis while finishing higher on a YOY basis for the first time in five months, increasing by 21.2%. Domestic dry whey demand increased on a YOY basis for the first time in six months, finishing up 26.2%, while export volumes remained strong, increasing by 14.7% throughout the month. ’15-’16 annual U.S. dry whey disappearance finished up 7.3% YOY as domestic demand increased to an eight year high. ’16-’17 YTD dry whey disappearance remains down 5.9% throughout the first third of the production season, despite the recently exhibited strength.
Dry Whey – Disappearance Finishes Higher on a YOY Basis for the First Time in Five Months
Jan ’17 U.S. dry whey commercial disappearanceincreased 10.1% MOM on a daily average basis while finishing higher on a YOY basis for the first time in five months, increasing by 21.2%. Domestic dry whey demand increased on a YOY basis for the first time in six months, finishing up 26.2%, while export volumes remained strong, increasing by 14.7% throughout the month. ’15-’16 annual U.S. dry whey disappearance finished up 7.3% YOY as domestic demand increased to an eight year high. ’16-’17 YTD dry whey disappearance remains down 5.9% throughout the first third of the production season, despite the recently exhibited strength.
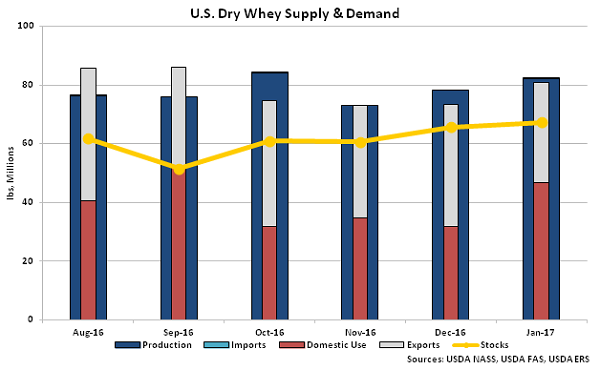
 Jan ’17 U.S. dry whey production and import volumes outpaced total disappearance figures, resulting in the third increase in stocks experienced throughout the past four months.
 WPC – Disappearance Declines on a YOY Basis on Weak Domestic Demand
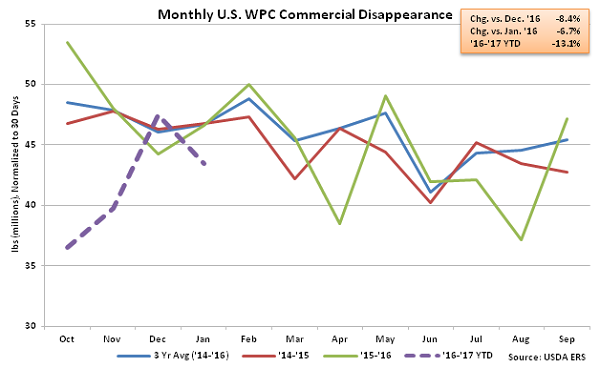
Jan ’17 U.S. whey protein concentrate (WPC) commercial disappearance declined 8.4% MOM on a daily average basis and 6.7% YOY, finishing lower on a YOY basis for the third time in the past four months. WPC export volumes increased on a YOY basis for the 17th time in the past 18 months, finishing up 51.5%, however domestic demand declined 46.0% YOY throughout the month. ’15-’16 annual U.S. WPC disappearance increased 0.8% YOY as record high export volumes more than offset a 20.0% decline in domestic demand. ’16-’17 YTD WPC disappearance has declined 13.1% throughout the first third of the production season, however, as domestic demand has remained weak.
WPC – Disappearance Declines on a YOY Basis on Weak Domestic Demand
Jan ’17 U.S. whey protein concentrate (WPC) commercial disappearance declined 8.4% MOM on a daily average basis and 6.7% YOY, finishing lower on a YOY basis for the third time in the past four months. WPC export volumes increased on a YOY basis for the 17th time in the past 18 months, finishing up 51.5%, however domestic demand declined 46.0% YOY throughout the month. ’15-’16 annual U.S. WPC disappearance increased 0.8% YOY as record high export volumes more than offset a 20.0% decline in domestic demand. ’16-’17 YTD WPC disappearance has declined 13.1% throughout the first third of the production season, however, as domestic demand has remained weak.
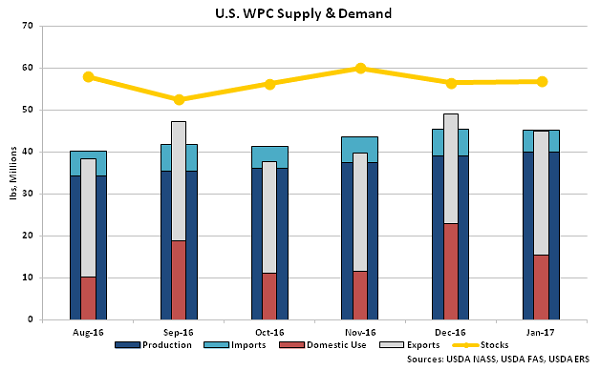
 Jan ’17 U.S. WPC production and import volumes outpaced total disappearance figures, resulting in the third increase in stocks experienced throughout the past four months.
 NFDM/SMP – Disappearance Declines to an Eight Year Seasonal Low, Finishes Down 26.9%
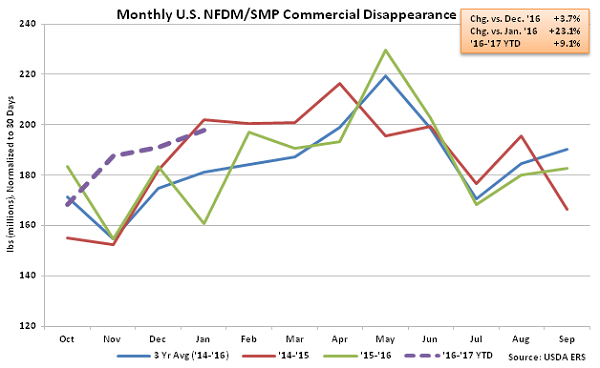
Jan ’17 U.S. nonfat dry milk (NFDM) and skim milk powder (SMP) commercial disappearance increased 3.7% MOM on a daily average basis and 23.1% YOY, finishing higher on a YOY basis for the third consecutive month. In addition, Dec ’16 NFDM/SMP figures were revised significantly higher, previously up 40.0% from the previously stated 14 year low. Jan ’17 U.S. NFDM/SMP domestic disappearance increased 38.7% on a YOY basis while export volumes increased YOY for the seventh consecutive month, finishing up 11.3%. ’15-’16 annual U.S. NFD1M/SMP disappearance declined 0.7% YOY as a 3.8% decline in domestic demand more than offset a 2.2% increase in export volumes. ’16-’17 YTD NFDM/SMP disappearance has rebounded by 9.1% throughout the first third of the production season.
NFDM/SMP – Disappearance Declines to an Eight Year Seasonal Low, Finishes Down 26.9%
Jan ’17 U.S. nonfat dry milk (NFDM) and skim milk powder (SMP) commercial disappearance increased 3.7% MOM on a daily average basis and 23.1% YOY, finishing higher on a YOY basis for the third consecutive month. In addition, Dec ’16 NFDM/SMP figures were revised significantly higher, previously up 40.0% from the previously stated 14 year low. Jan ’17 U.S. NFDM/SMP domestic disappearance increased 38.7% on a YOY basis while export volumes increased YOY for the seventh consecutive month, finishing up 11.3%. ’15-’16 annual U.S. NFD1M/SMP disappearance declined 0.7% YOY as a 3.8% decline in domestic demand more than offset a 2.2% increase in export volumes. ’16-’17 YTD NFDM/SMP disappearance has rebounded by 9.1% throughout the first third of the production season.
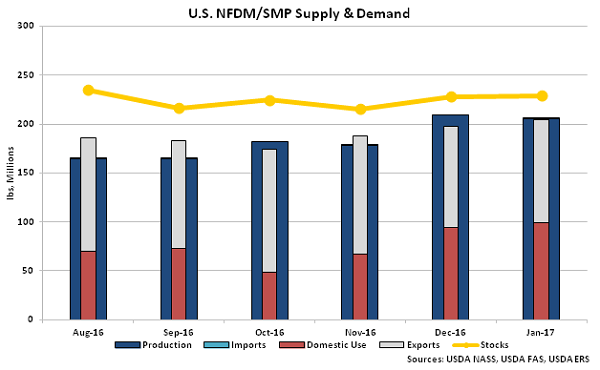
 Jan ’17 U.S. NFDM/SMP production and import volumes outpaced total disappearance figures, resulting in stocks increasing for the second consecutive month.
 Fluid Milk Sales – Total Milk Sales Decline 0.3% YOY on Continued Weak Skim Milk Demand
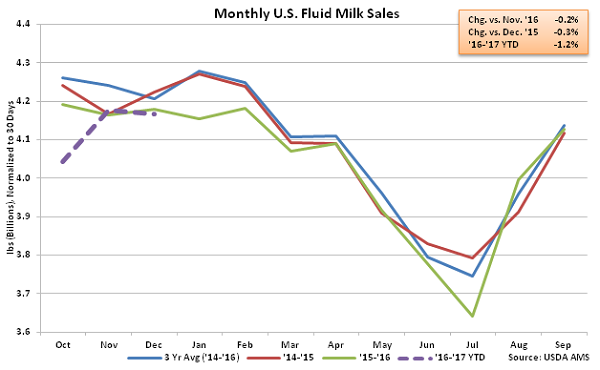
Dec ’16 U.S. fluid milk sales of 4.31 billion pounds declined 0.2% MOM on a daily average basis and 0.3% YOY. Sales of whole milk increased on a YOY basis for the 25th consecutive month, finishing up 5.6%, however fat-free milk sales declined 10.3% YOY throughout the month. ’15-’16 annual U.S. total fluid milk sales declined to a record low for the seventh consecutive year, finished down 0.8% YOY. Annual whole milk sales finished up 5.0% however annual fat-free milk sales declined 11.3% throughout the year. ’16-’17 YTD total fluid milk sales are down an additional 1.2% throughout the first quarter of the production season.
Fluid Milk Sales – Total Milk Sales Decline 0.3% YOY on Continued Weak Skim Milk Demand
Dec ’16 U.S. fluid milk sales of 4.31 billion pounds declined 0.2% MOM on a daily average basis and 0.3% YOY. Sales of whole milk increased on a YOY basis for the 25th consecutive month, finishing up 5.6%, however fat-free milk sales declined 10.3% YOY throughout the month. ’15-’16 annual U.S. total fluid milk sales declined to a record low for the seventh consecutive year, finished down 0.8% YOY. Annual whole milk sales finished up 5.0% however annual fat-free milk sales declined 11.3% throughout the year. ’16-’17 YTD total fluid milk sales are down an additional 1.2% throughout the first quarter of the production season.
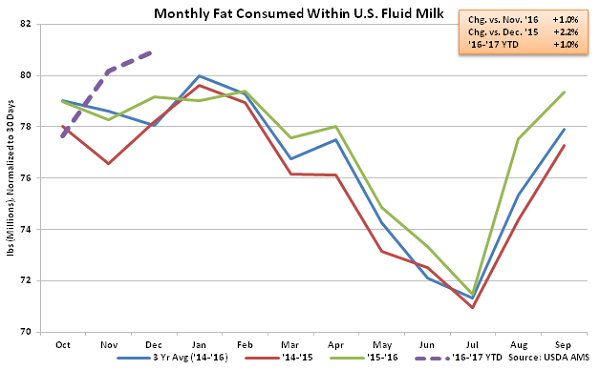
 Fat consumed within U.S. fluid milk increased on a YOY basis for the tenth time in the past 11 months during Dec ’16, finishing up 2.2%. ’15-’16 annual total fat consumed within U.S. fluid milk increased 1.6% YOY and ’16-’17 YTD figures are up an additional 1.0% throughout the first quarter of the production season.
 Overall, Jan ’17 domestic commercial disappearance increased most significantly on a YOY basis for NFDM/SMP and dry whey, while international disappearance finished most significantly higher for butter and WPC throughout the month.
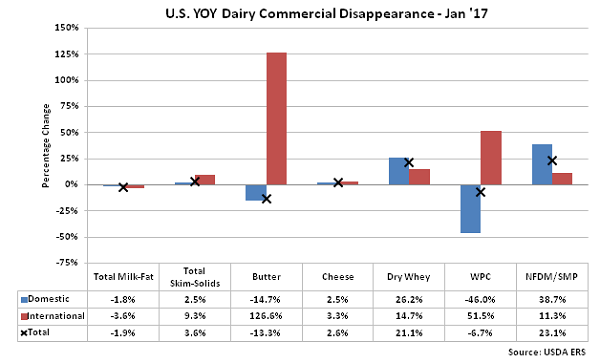
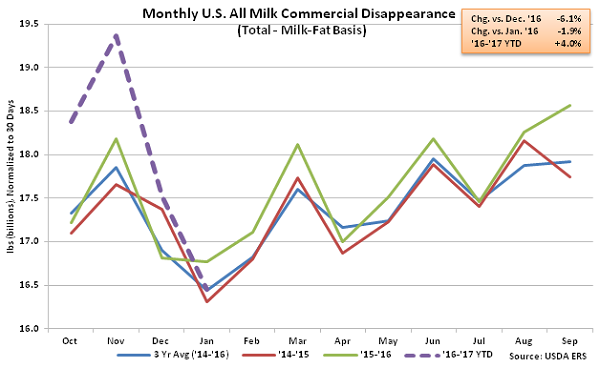
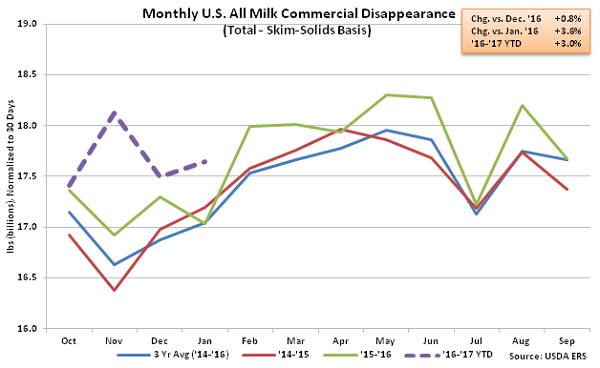
- Jan ’17 U.S. commercial disappearance for milk used in all products declined YOY for the first time in 13 months on a milk-fat basis but remained higher YOY on a skim-solids basis, finishing at a record seasonal high.
- Jan ’17 butter commercial disappearance finished lower on a YOY basis for the first time in 13 months however cheese disappearance reached a record seasonal high for the month of January. Dry whey disappearance increased on a YOY basis for the first time in five months during Jan ’17 while nonfat dry milk disappearance finished higher for the third consecutive month.
- U.S. fluid milk sales remained lower on a YOY basis during Dec ’16, finishing down 0.3%. Sales of whole milk increased on a YOY basis for the 25th consecutive month during Dec ’16, however skim milk sales remained weak, declining by 10.3%.
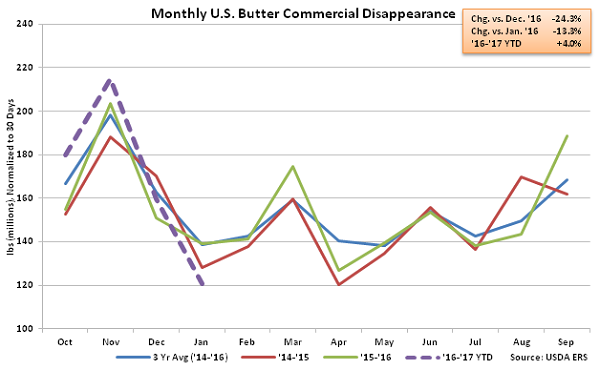
Butter – Disappearance Declines to a 21 Month Low on Weak Domestic Demand
Jan ’17 U.S. butter commercial disappearance declined 24.3% MOM on a daily average basis and 13.3% YOY, finishing at a five year seasonal low and a 21 month low overall. Jan ’17 domestic butter demand declined 14.7% YOY to a five year low for the month of January however international demand increased 126.6% from the nine year seasonal low experienced during the previous year. ’15-’16 annual U.S. butter disappearance increased 2.2% YOY as a 3.3% increase in domestic demand more than offset a 43.7% decline in export volumes. ’16-’17 YTD U.S. butter disappearance remains up an additional 4.0% throughout the first third of the production season, despite the recently experienced weakness.
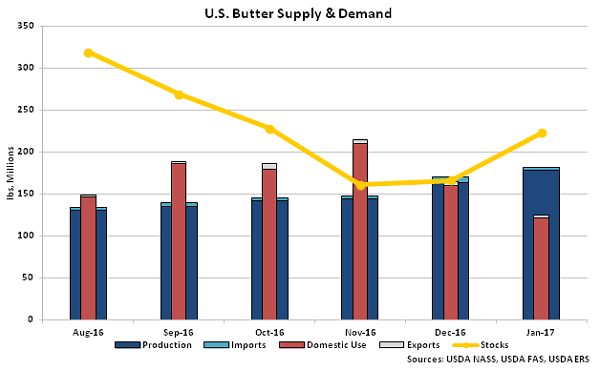
Jan ’17 U.S. butter production and import volumes outpaced total disappearance figures, resulting in stocks increasing for the second consecutive month. Butter stocks typically increase seasonally from lows experienced throughout the month of November until seasonal highs are reached during the summer months.
Cheese – Disappearance Reaches a Record Seasonal High, Finishes up 2.6% YOY
Jan ’17 U.S. cheese commercial disappearance declined 4.4% MOM on a daily average basis but remained 2.6% higher on a YOY basis, finishing at a record seasonal high. Total cheese disappearance has finished higher on a YOY basis over 19 consecutive months through January. American cheese disappearance declined 1.8% YOY however the declines were more than offset by a 5.3% YOY increase in other-than-American cheese disappearance experienced throughout the month. Total domestic cheese demand increased 2.5% YOY throughout the month while export demand finished higher on a YOY basis for the fourth consecutive month, increasing by 3.3%. Domestic cheese disappearance increased 3.7% throughout the ’15-’16 production season, more than offsetting a 14.0% decline in export demand. ’16-’17 YTD cheese disappearance remains up an additional 2.7% throughout the first third of the production season as both domestic and export demand has strengthened.
Jan ’17 U.S. cheese production and import volumes outpaced total disappearance figures, resulting in stocks increasing for the second consecutive month. Cheese stocks typically reach seasonal lows during the month of November prior to building throughout subsequent months.
Dry Whey – Disappearance Finishes Higher on a YOY Basis for the First Time in Five Months
Jan ’17 U.S. dry whey commercial disappearanceincreased 10.1% MOM on a daily average basis while finishing higher on a YOY basis for the first time in five months, increasing by 21.2%. Domestic dry whey demand increased on a YOY basis for the first time in six months, finishing up 26.2%, while export volumes remained strong, increasing by 14.7% throughout the month. ’15-’16 annual U.S. dry whey disappearance finished up 7.3% YOY as domestic demand increased to an eight year high. ’16-’17 YTD dry whey disappearance remains down 5.9% throughout the first third of the production season, despite the recently exhibited strength.
Jan ’17 U.S. dry whey production and import volumes outpaced total disappearance figures, resulting in the third increase in stocks experienced throughout the past four months.
WPC – Disappearance Declines on a YOY Basis on Weak Domestic Demand
Jan ’17 U.S. whey protein concentrate (WPC) commercial disappearance declined 8.4% MOM on a daily average basis and 6.7% YOY, finishing lower on a YOY basis for the third time in the past four months. WPC export volumes increased on a YOY basis for the 17th time in the past 18 months, finishing up 51.5%, however domestic demand declined 46.0% YOY throughout the month. ’15-’16 annual U.S. WPC disappearance increased 0.8% YOY as record high export volumes more than offset a 20.0% decline in domestic demand. ’16-’17 YTD WPC disappearance has declined 13.1% throughout the first third of the production season, however, as domestic demand has remained weak.
Jan ’17 U.S. WPC production and import volumes outpaced total disappearance figures, resulting in the third increase in stocks experienced throughout the past four months.
NFDM/SMP – Disappearance Declines to an Eight Year Seasonal Low, Finishes Down 26.9%
Jan ’17 U.S. nonfat dry milk (NFDM) and skim milk powder (SMP) commercial disappearance increased 3.7% MOM on a daily average basis and 23.1% YOY, finishing higher on a YOY basis for the third consecutive month. In addition, Dec ’16 NFDM/SMP figures were revised significantly higher, previously up 40.0% from the previously stated 14 year low. Jan ’17 U.S. NFDM/SMP domestic disappearance increased 38.7% on a YOY basis while export volumes increased YOY for the seventh consecutive month, finishing up 11.3%. ’15-’16 annual U.S. NFD1M/SMP disappearance declined 0.7% YOY as a 3.8% decline in domestic demand more than offset a 2.2% increase in export volumes. ’16-’17 YTD NFDM/SMP disappearance has rebounded by 9.1% throughout the first third of the production season.
Jan ’17 U.S. NFDM/SMP production and import volumes outpaced total disappearance figures, resulting in stocks increasing for the second consecutive month.
Fluid Milk Sales – Total Milk Sales Decline 0.3% YOY on Continued Weak Skim Milk Demand
Dec ’16 U.S. fluid milk sales of 4.31 billion pounds declined 0.2% MOM on a daily average basis and 0.3% YOY. Sales of whole milk increased on a YOY basis for the 25th consecutive month, finishing up 5.6%, however fat-free milk sales declined 10.3% YOY throughout the month. ’15-’16 annual U.S. total fluid milk sales declined to a record low for the seventh consecutive year, finished down 0.8% YOY. Annual whole milk sales finished up 5.0% however annual fat-free milk sales declined 11.3% throughout the year. ’16-’17 YTD total fluid milk sales are down an additional 1.2% throughout the first quarter of the production season.
Fat consumed within U.S. fluid milk increased on a YOY basis for the tenth time in the past 11 months during Dec ’16, finishing up 2.2%. ’15-’16 annual total fat consumed within U.S. fluid milk increased 1.6% YOY and ’16-’17 YTD figures are up an additional 1.0% throughout the first quarter of the production season.
Overall, Jan ’17 domestic commercial disappearance increased most significantly on a YOY basis for NFDM/SMP and dry whey, while international disappearance finished most significantly higher for butter and WPC throughout the month.